NCERT Solutions for Class 10 Maths Chapter 14 Statistics Ex 14.1 are part of NCERT Solutions for Class 10 Maths. Here are we have given Chapter 14 Statistics Class 10 NCERT Solutions Ex 14.1.
Students find NCERT Solutions for Class 10 Maths Chapter 14 Statistics quite helpful for their CBSE Board Preparation. Refer to our Textbook Solutions any time, while doing your homework or while preparing for the exam. All questions and answers from the NCERT Book of class 10 Math Chapter 14 are provided here for you for free.
| Board | CBSE |
| Textbook | NCERT |
| Class | Class 10 |
| Subject | Maths |
| Chapter | Chapter 14 |
| Chapter Name | Statistics |
| Exercise | Ex 14.1 |
| Number of Questions Solved | 9 |
| Category | NCERT Solutions |
NCERT Solutions for Class 10 Maths Chapter 14 Statistics Ex 14.1
NCERT Solutions for Class 10 Maths
Question 1.
A survey was conducted by a group of students as a part of their environment awareness programme, in which they collected the following data regarding the number of plants in 20 houses in a locality. Find the mean number of plants per house.
| Number of plants | 0 – 2 | 2 – 4 | 4 – 6 | 6 – 8 | 8 – 10 | 10 – 12 | 12 – 14 |
| Number of houses | 1 | 2 | 1 | 5 | 6 | 2 | 3 |
Which method did you use for finding the mean, and why?
Solution:
Let us find class marks (xi) for each interval by using the relation.
![]()
Now we may compute xi and fixi as following
| Number of plants | Number of houses (fi) | xi | fixi |
| 0 – 2 | 1 | 1 | 1— 1 = 1 |
| 2 – 4 | 2 | 3 | 2 — 3 = 6 |
| 4 – 6 | 1 | 5 | 1 — 5 = 5 |
| 6 – 8 | 5 | 7 | 5 — 7 = 35 |
| 8 – 10 | 6 | 9 | 6 — 9 = 54 |
| 10 – 12 | 2 | 11 | 2 —11 = 22 |
| 12 – 14 | 3 | 13 | 3 — 13 = 39 |
| Total | 20 | 162 |
From the table we may observe that
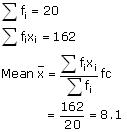
So, mean number of plants per house is 8.1.
We have used here direct method as values of class marks (xi) and fi are small.
Question 2.
Consider the following distribution of daily wages of 50 worker of a factory.
| Daily wages (in Rs) | 100 – 120 | 120 – 140 | 140 -160 | 160 – 180 | 180 – 200 |
| Number of workers | 12 | 14 | 8 | 6 | 10 |
Solution:
Let us find class mark for each interval by using the relation.
![]()
Class size (h) of this data = 20
Now taking 150 as assured mean (a) we may calculate di, ui and fiui as following.
| Daily wages (in Rs) | Number of workers (fi) | xi | di = xi – 150 |  | fiui |
| 100 -120 | 12 | 110 | – 40 | -2 | – 24 |
| 120 – 140 | 14 | 130 | – 20 | -1 | – 14 |
| 140 – 160 | 8 | 150 | 0 | 0 | 0 |
| 160 -180 | 6 | 170 | 20 | 1 | 6 |
| 180 – 200 | 10 | 190 | 40 | 2 | 20 |
| Total | 50 | -12 |
From the table we may observe that
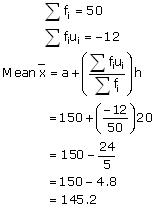
So mean daily wages of the workers of the factory is Rs.145.20
Question 3.
The following distribution shows the daily pocket allowance of children of a locality. The mean pocket allowance is Rs.18. Find the missing frequency f.
| Daily pocket allowance (in Rs) | 11 – 13 | 13 – 15 | 15 -17 | 17 – 19 | 19 – 21 | 21 – 23 | 23 – 25 |
| Number of workers | 7 | 6 | 9 | 13 | f | 5 | 4 |
Solution:
We may find class mark (xi) for each interval by using the relation.
![]()
Given that mean pocket allowance \(\overline { x } \) = Rs.18
Now taking 18 as assured mean (a) we may calculate di and fidi as following.
| Daily pocket allowance (in Rs.) | Number of children fi | Class mark xi | di = xi – 18 | fidi |
| 11 – 13 | 7 | 12 | – 6 | – 42 |
| 13 – 15 | 6 | 14 | – 4 | – 24 |
| 15 – 17 | 9 | 16 | – 2 | – 18 |
| 17 – 19 | 13 | 18 | 0 | 0 |
| 19 – 21 | f | 20 | 2 | 2 f |
| 21 – 23 | 5 | 22 | 4 | 20 |
| 23 – 25 | 4 | 24 | 6 | 24 |
| Total | 2f – 40 |
From the table we may obtain
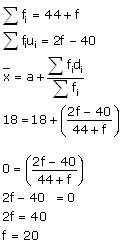
Hence the missing frequency f is 20.
Question 4.
Thirty women were examined in a hospital by a doctor and the number of heart beats per minute were recorded and summarized as follows. Fine the mean heart beats per minute for these women, choosing a suitable method.
| Number of heart beats per minute | 65 – 68 | 68 – 71 | 71-74 | 74 – 77 | 77 – 80 | 80 – 83 | 83 – 86 |
| Number of women | 2 | 4 | 3 | 8 | 7 | 4 | 2 |
Solution:
We may find class mark of each interval (xi) by using the relation.
![]()
Class size h of this data = 3
Now taking 75.5 as assumed mean (a) we may calculate di, ui, fiui as following.
| Number of heart beats per minute | Number of women fi | xi | di = xi -75.5 |  | fiui |
| 65 – 68 | 2 | 66.5 | – 9 | – 3 | – 6 |
| 68 – 71 | 4 | 69.5 | – 6 | – 2 | – 8 |
| 71 – 74 | 3 | 72.5 | – 3 | – 1 | – 3 |
| 74 – 77 | 8 | 75.5 | 0 | 0 | 0 |
| 77 – 80 | 7 | 78.5 | 3 | 1 | 7 |
| 80 – 83 | 4 | 81.5 | 6 | 2 | 8 |
| 83 – 86 | 2 | 84.5 | 9 | 3 | 6 |
| Total | 30 | 4 |
Now we may observe from table that
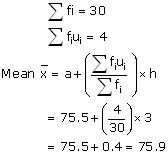
So mean heart beats per minute for these women are 75.9 beats per minute.
Question 5.
In a retail market, fruit vendors were selling mangoes kept in packing boxes. These boxes contained varying number of mangoes. The following was the distribution of mangoes according to the number of boxes.
| Number of mangoes | 50 – 52 | 53 – 55 | 56 – 58 | 59 – 61 | 62 – 64 |
| Number of boxes | 15 | 110 | 135 | 115 | 25 |
Find the mean number of mangoes kept in a packing box. Which method of finding the mean did you choose?
Solution:
| Number of mangoes | Number of boxes fi |
| 50 – 52 | 15 |
| 53 – 55 | 110 |
| 56 – 58 | 135 |
| 59 – 61 | 115 |
| 62 – 64 | 25 |
We may observe that class intervals are not continuous. There is a gap of 1 between two class intervals. So we have to add 1/2 to upper class limit and subtract 1/2 from lower class limit of each interval.
And class mark (xi) may be obtained by using the relation
![]()
Class size (h) of this data = 3
Now taking 57 as assumed mean (a) we may calculate di, ui, fiui as following –
| Class interval | fi | xi | di = xi – 57 |  | fiui |
| 49.5 – 52.5 | 15 | 51 | -6 | -2 | -30 |
| 52.5 – 55.5 | 110 | 54 | -3 | -1 | -110 |
| 55.5 – 58.5 | 135 | 57 | 0 | 0 | 0 |
| 58.5 – 61.5 | 115 | 60 | 3 | 1 | 115 |
| 61.5 – 64.5 | 25 | 63 | 6 | 2 | 50 |
| Total | 400 | 25 |
Now we may observe that
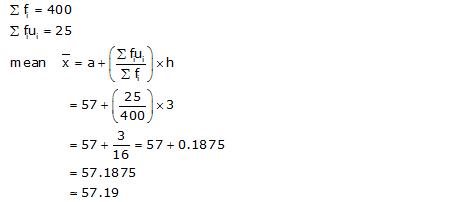
Clearly, mean number of mangoes kept in a packing box is 57.19.
We have chosen step deviation method here as values of fi, di are big and also there is a common multiple between all di.
Question 6.
The table below shows the daily expenditure on food of 25 households in a locality.
| Daily expenditure (in Rs) | 100 – 150 | 150 – 200 | 200 – 250 | 250 – 300 | 300 – 350 |
| Number of households | 4 | 5 | 12 | 2 | 2 |
Find the mean daily expenditure on food by a suitable method.
Solution:
We may calculate cla
mark (xi) for each interval by using the relation
![]()
Class size = 50
Now taking 225 as assumed mean (a) we may calculate di, ui, fiui as following
| Daily expenditure (in Rs) | fi | xi | di = xi – 225 |  | fiui |
| 100 – 150 | 4 | 125 | -100 | -2 | -8 |
| 150 – 200 | 5 | 175 | -50 | -1 | -5 |
| 200 – 250 | 12 | 225 | 0 | 0 | 0 |
| 250 – 300 | 2 | 275 | 50 | 1 | 2 |
| 300 – 350 | 2 | 325 | 100 | 2 | 4 |
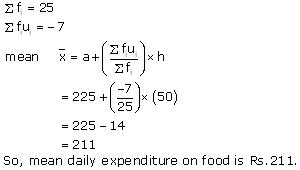
| Total | 25 | -7 |
Now we may observe that –
Question 7.
To find out the concentration of SO2 in the air (in parts per million, i.e., ppm), the data was collected for 30 localities in a certain city and is presented below:
| concentration of SO2 (in pmm) | Frequency |
| 0.00 – 0.04 | 4 |
| 0.04 – 0.08 | 9 |
| 0.08 – 0.12 | 9 |
| 0.12 – 0.16 | 2 |
| 0.16 – 0.20 | 4 |
| 0.20 – 0.24 | 2 |
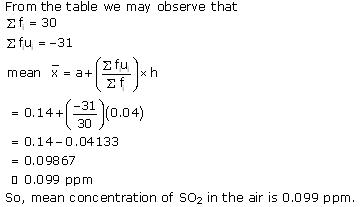
Find the mean concentration of SO2 in the air.
Solution:
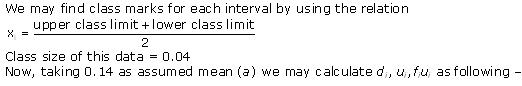
| Concentration of SO2 (in ppm) | Frequency | Class mark xi | di = xi – 0.14 |  | fiui |
| 0.00 – 0.04 | 4 | 0.02 | -0.12 | -3 | -12 |
| 0.04 – 0.08 | 9 | 0.06 | -0.08 | -2 | -18 |
| 0.08 – 0.12 | 9 | 0.10 | -0.04 | -1 | -9 |
| 0.12 – 0.16 | 2 | 0.14 | 0 | 0 | 0 |
| 0.16 – 0.20 | 4 | 0.18 | 0.04 | 1 | 4 |
| 0.20 – 0.24 | 2 | 0.22 | 0.08 | 2 | 4 |
| Total | 30 | -31 |
Question 8.
A class teacher has the following absentee record of 40 students of a class for the whole term. Find the mean number of days a student was absent.
| Number of days | 0 – 6 | 6 – 10 | 10 – 14 | 14 – 20 | 20 – 28 | 28 – 38 | 38 – 40 |
| Number of students | 11 | 10 | 7 | 4 | 4 | 3 | 1 |
Solution:
We may find class mark of each interval by using the relation

Now taking 16 as assumed mean (a) we may calculate di and fidi as following
| Number of days | Number of students fi | xi | di= xi – 16 | fidi |
| 0 – 6 | 11 | 3 | -13 | -143 |
| 6 -10 | 10 | 8 | -8 | -80 |
| 10 – 14 | 7 | 12 | -4 | -28 |
| 14 – 20 | 4 | 16 | 0 | 0 |
| 20 – 28 | 4 | 24 | 8 | 32 |
| 28 – 38 | 3 | 33 | 17 | 51 |
| 38 – 40 | 1 | 39 | 23 | 23 |
| Total | 40 | -145 |
Now we may observe that
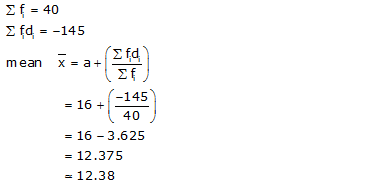
So, mean number of days is 12.38 days, for which a student was absent.
Question 9.
The following table gives the literacy rate (in percentage) of 35 cities. Find the mean literacy rate.
| Literacy rate (in %) | 45 – 55 | 55 – 65 | 65 – 75 | 75 – 85 | 85 – 95 |
| Number of cities | 3 | 10 | 11 | 8 | 3 |
Solution:
We may find class marks by using the relation
![]()
Class size (h) for this data = 10
Now taking 70 as assumed mean (a) we may calculate di, ui, and fiui as following
| Literacy rate (in %) | Number of cities fi | xi | di= xi – 70 | ui | fiui |
| 45 – 55 | 3 | 50 | -20 | -2 | -6 |
| 55 – 65 | 10 | 60 | -10 | -1 | -10 |
| 65 – 75 | 11 | 70 | 0 | 0 | 0 |
| 75 – 85 | 8 | 80 | 10 | 1 | 8 |
| 85 – 95 | 3 | 90 | 20 | 2 | 6 |
| Total | 35 | -2 |
Now we may observe that

So, mean literacy rate is 69.43%.
We hope the NCERT Solutions for Class 10 Maths Chapter 14 Statistics Ex 14.1 help you. If you have any query regarding NCERT Solutions for Class 10 Maths Chapter 14 Statistics Ex 14.1, drop a comment below and we will get back to you at the earliest.
NCERT Solutions For Class 10 Maths – AplusTopperhttps://t.co/q7hSKh3xmf#NCERTSolutionsForClass10Maths #NCERTSolutions #AplusTopper
— ObulReddy cbse (@ObulReddyCBSE) August 3, 2018