Graphing Functions and Examining Coefficients
Behavior of Specific Functions
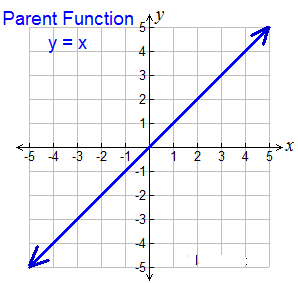
Linear Functions:
Linear functions are straight lines. Form being examined is y = mx + b.
Equation Forms:
- Slope-Intercept Form:
y = mx + b
m = slope; b = y-intercept - Point-Slope Form:
y – y1 = m(x – x1)
uses point (x1,y1) and m - Standard Form:
Ax + By = C
A, B and C are integers.
A is positive.
Finding Slope:
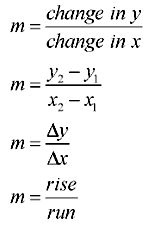
Some Observations:
- If the slope, m, is positive, the line slants uphill. As the slope gets larger, the uphill slant of the line gets steeper. As the slope gets extremely large (a very big number), the line becomes nearly vertical. If the line is vertical, the slope is undefined (because it has no horizontal change).
- As the slope gets smaller (closer to zero), the line loses steepness and starts to flatten. If the slope is zero, the line is horizontal (flat),
- If the slope is negative the line slants downhill. As the slope decreases (remember -2 is > -3), the downhill slant of the line gets steeper.
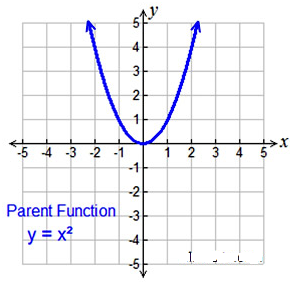
Quadratic Functions:
Quadratic functions are parabolas.
Form being examined is y = ax².
Equation Forms:
- Vertex Form:
y = a(x – h)2 + k
with vertex (h,k)
shows vertex, max/min, inc/dec - Point-Slope Form:
y = ax2 + bx + c
negative “a” opens down - Intercept Form:
y = a(x – p)(x – q)
p and q are x-intercepts.
shows roots, pos/neg
Axis of Symmetry:
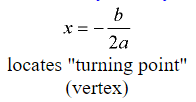
Some Observations:
- If the coefficient of x² gets larger, the parabola becomes thinner (narrower), closer to its line of symmetry.
- If the coefficient of x² gets smaller, the parabola becomes thicker (wider), further from its line of symmetry.
- If the coefficient of x² is negative, the parabola opens downward.
Absolute Value Functions:
The graph of the absolute value function takes the shape of a V.
Form being examined is y = | x |.
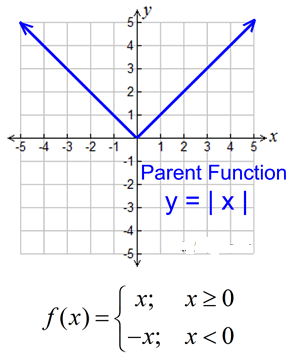
Notice that the graphs of these absolute value functions are on or above the x-axis. Absolute value always yields answers which are positive or zero.
Features (of parent function):
- Domain: All Reals (-∞,∞)
Unless domain is altered. - Range: [0,∞)
- increasing (0, ∞)
- decreasing (-∞,0)
- positive (-∞, 0) U (0, -∞)
- absolute/relative min is 0
- no absolute max (graph → ∞)
- end behavior
f (x) → +∞, as x → +∞
f (x) → +∞, as x → -∞ - Symmetric: about x = 0 unless domain is altered
- x-intercept:
intersects x-axis at (0, 0) unless domain is altered - y-intercept:
intersects y-axis at (0, 0) unless domain is altered - Vertex:
the point (0,0) unless domain is altered
Some Observations:
- As the coefficient of x gets larger, the graph becomes thinner, closer to its line of symmetry.
- As the coefficient of x gets smaller, the graph becomes thicker, further from its line of symmetry.
- If the coefficient of x is negative, the graph is the same as if that coefficient were positive. It is acted upon by the absolute value property.
Exponential Functions:
Exponential functions have the variable x as an exponent.
Form being examined is y = ax.
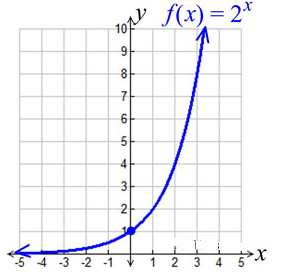
Features (for this graph):
- the domain is all Real numbers.
- the range is all positive real numbers (not zero).
- graph has a y-intercept at (0,1). Remember any number to the zero power is 1.
- when b > 1, the graph increases. The greater the base, b, the faster the graph rises from left to right.
- when 0 < b < 1, the graph decreases.
- has an asymptote (a line that the graph gets very, very close to, but never crosses or touches). For this graph the
asymptote is the x-axis (y = 0).
Notice that all of the exponential graphs pass through the point (0,1). This occurs because values raised to the zero power equal 1.
Some Observations:
- As the base value ( a ) gets larger, the graph becomes steeper faster – it appears to stretch upward more quickly.
- As the base value ( a ) gets closer to 1, the graph flattens. If the base were to become one, the graph would be a horizontal (flat) straight line (not an exponential graph).
- If the base value ( a ) is between 0 and 1, the graph appears to have reflected itself over the y-axis. The graph has just turned from exponential growth to exponential decay.