• Skip to main content
  • Skip to secondary menu
  • Skip to primary sidebar
  • Skip to footer
  • ICSE Solutions
    • ICSE Solutions for Class 10
    • ICSE Solutions for Class 9
    • ICSE Solutions for Class 8
    • ICSE Solutions for Class 7
    • ICSE Solutions for Class 6
  • Selina Solutions
  • ML Aggarwal Solutions
  • ISC & ICSE Papers
    • ICSE Previous Year Question Papers Class 10
    • ISC Previous Year Question Papers
    • ICSE Specimen Paper 2021-2022 Class 10 Solved
    • ICSE Specimen Papers 2020 for Class 9
    • ISC Specimen Papers 2020 for Class 12
    • ISC Specimen Papers 2020 for Class 11
    • ICSE Time Table 2020 Class 10
    • ISC Time Table 2020 Class 12
  • Maths
    • Merit Batch

A Plus Topper

Improve your Grades

  • CBSE Sample Papers
  • HSSLive
    • HSSLive Plus Two
    • HSSLive Plus One
    • Kerala SSLC
  • Exams
  • NCERT Solutions for Class 10 Maths
  • NIOS
  • Chemistry
  • Physics
  • ICSE Books

Scatter Plots and Correlation

December 9, 2020 by sastry

Scatter Plots and Correlation

Statisticians and quality control technicians gather data to determine correlations (relationships) between such events. Scatter plots will often show at a glance whether a relationship exists between two sets of data.

Let’s decide if studying longer will affect Regents grades based upon a specific set of data. Given the data below, a scatter plot has been prepared to represent the data. Remember when making a scatter plot, do NOT connect the dots.

Scatter Plots and Correlation 1

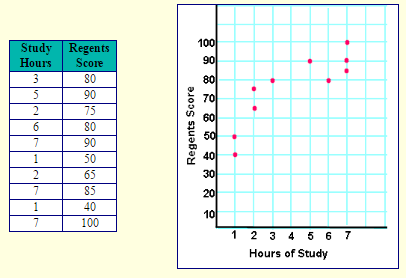
Notice: Certain values may have more than one result,
such as (7,90) and (7,85) and (7,100).

The data displayed on the graph resembles a line rising from left to right. Since the slope of the line is positive, there is a positive correlation between the two sets of data. This means that according to this set of data, the longer I study, the better grade I will get on my Regents examination.

Note: Just because this set of data showed a positive correlation does not mean that the relationship is positive for all sets of data concerning study time and Regents scores. There may be sets of data that show that there is NOT a positive correlation between hours studying and better Regents scores.
It all depends on the data being examined.

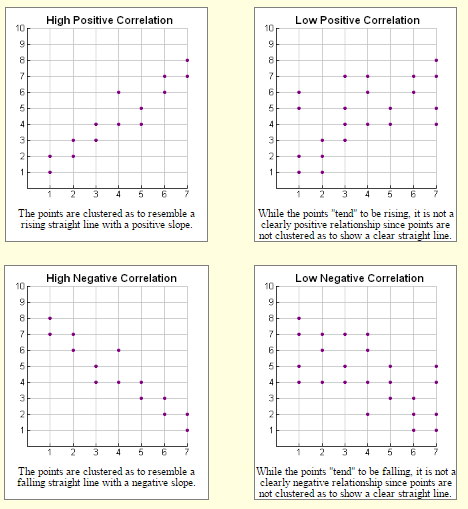
If the slope of the line had been negative (falling from left to right), a negative correlation would exist since the slope of the line would have been negative. Under a negative correlation, the longer I study, the worse grade I would get on my Regents examination. YEEK!!
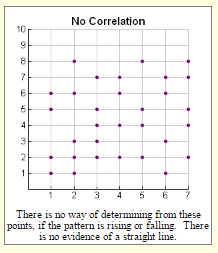
If the plot on the graph is scattered in such a way that it does not approximate a line (it does not appear to rise or fall), there is no correlation between the sets of data. No correlation means that the data just doesn’t show if studying longer has any affect on Regents examination scores.

Check out these graphs for visual interpretations of types of correlations:

Scatter Plots and Correlation 2

Scatter Plots and Correlation 3

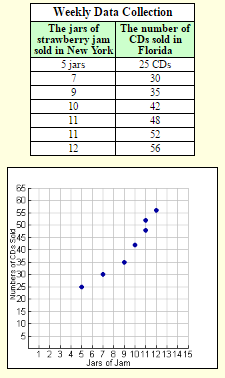
During the months of February and March, the weekly number of jars of strawberry jam sold at a local market in New York was recorded. For the same time frame, the number of copies of a popular classical music CD sold in Florida was recorded. The data was examined and was plotted

From looking at the graph, it can be seen that there is a high positive correlation between these two sets of data.

So, this must mean that the number of jars of strawberry jam sold in New York was causing an increase in the number of classical music CDs sold in Florida. Of course this is not true!

Always be careful what you infer from your statistical analyses. Be sure the relationship makes sense. Also keep in mind that other factors may be involved in a cause-effect relationship.

Scatter Plots and Correlation 4

Filed Under: Mathematics Tagged With: Scatter Plots and Correlation

Primary Sidebar

  • MCQ Questions
  • RS Aggarwal Solutions
  • RS Aggarwal Solutions Class 10
  • RS Aggarwal Solutions Class 9
  • RS Aggarwal Solutions Class 8
  • RS Aggarwal Solutions Class 7
  • RS Aggarwal Solutions Class 6
  • ICSE Solutions
  • Selina ICSE Solutions
  • Concise Mathematics Class 10 ICSE Solutions
  • Concise Physics Class 10 ICSE Solutions
  • Concise Chemistry Class 10 ICSE Solutions
  • Concise Biology Class 10 ICSE Solutions
  • Concise Mathematics Class 9 ICSE Solutions
  • Concise Physics Class 9 ICSE Solutions
  • Concise Chemistry Class 9 ICSE Solutions
  • Concise Biology Class 9 ICSE Solutions
  • ML Aggarwal Solutions
  • ML Aggarwal Class 10 Solutions
  • ML Aggarwal Class 9 Solutions
  • ML Aggarwal Class 8 Solutions
  • ML Aggarwal Class 7 Solutions
  • ML Aggarwal Class 6 Solutions
  • HSSLive Plus One
  • HSSLive Plus Two
  • Kerala SSLC

Recent Posts

  • Plus Two Accountancy Notes Chapter 3 Reconstitution of a Partnership Firm-Admission of Partner
  • ML Aggarwal Class 6 Solutions for ICSE Maths Chapter 13 Practical Geometry
  • Plus One Economics Notes Chapter 5 Human Capital Formation in India
  • Plus Two Business Studies Chapter Wise Questions and Answers Chapter 12 Consumer Protection
  • Plus One Economics Chapter Wise Questions and Answers Chapter 5 Human Capital Formation in India
  • Plus One Economics Chapter Wise Questions and Answers Chapter 10 Comparative Development Experience of India with its Neighbours
  • Plus Two Accountancy Notes Chapter 5 Dissolution of Partnership
  • Plus Two Business Studies Chapter Wise Questions and Answers Chapter 13 Entrepreneurial Development
  • Plus Two Business Studies Notes Chapter 11 Marketing Management
  • Plus One Economics Chapter Wise Questions and Answers Chapter 11 Introduction
  • Plus One Computer Science Chapter Wise Questions and Answers Kerala

Footer

  • RS Aggarwal Solutions
  • RS Aggarwal Solutions Class 10
  • RS Aggarwal Solutions Class 9
  • RS Aggarwal Solutions Class 8
  • RS Aggarwal Solutions Class 7
  • RS Aggarwal Solutions Class 6
  • Picture Dictionary
  • English Speech
  • ICSE Solutions
  • Selina ICSE Solutions
  • ML Aggarwal Solutions
  • HSSLive Plus One
  • HSSLive Plus Two
  • Kerala SSLC
  • Distance Education
DisclaimerPrivacy Policy
Area Volume Calculator