Kerala Plus One Economics Chapter Wise Questions and Answers Chapter 13 Organisation of Data
Plus One Economics Organisation of Data One Mark Questions and Answers
Question 1.
Under the inclusive method ……………
(a) Upper-class limit is excluded
(b) Lower class limit is excluded
(c) Lower class limit is included
(d) None of the above
Answer:
(c) Lower class limit is included
Question 2.
Which of the following alternatives is true?
The class midpoint is equal to:
(a) The average bf the upper-class limit and the lower class limit.
(b) The product of the upper-class limit and the lower class limit.
(c) The ratio of the upper-class limit and the lower class limit.
(d) None of the above.
Answer:
(a) The average bf the upper-class limit and the lower class limit.
Question 3.
Which of the following alternatives is true?
The frequency distribution of two variables is known as ………
(a) Univariate Distribution
(b) Bivariate Distribution
(c) Multivariate Distribution
(d) None of the above
Answer:
(b) Bivariate Distribution
Question 4.
Which of the following alternatives is true?
Statistical calculations in classified data are based on …………
(a) the actual values of observations
(b) the upper-class limits
(c) the lower class limits
(d) the class midpoints
Answer:
(d) the class midpoints
Question 5.
Which of the following alternatives is true?
Under Exclusive method.
(a) the upper-class limit of a class is excluded in the class interval
(b) the upper-class limit of a class is included in the class interval
(c) the lower class limit of a class is excluded in the class interval
(d) the lower class limit of a class is included in the class interval
Answer:
(a) the upper-class limit of a class is excluded in the class interval
Question 6.
Which of the following alternatives is true?
Range is the ………….
(a) difference between the largest and the smallest observations
(b) difference between the smallest and the largest observations
(c) average of the largest and the smallest observations
(d) ratio of the largest to the smallest observation.
Answer:
(a) difference between the largest and the smallest observations
Plus One Economics Organisation of Data Two Mark Questions and Answers
Question 1.
What is the classification?
Answer:
Classification of data is a technique with the help of which data is arranged into different groups or classes according to some common characteristics so as to facilitate the tabulation, analysis, and interpretation.
Question 2.
Distinguish between raw data and classified data.
Answer:
Raw data is the collected information in the form of numerical facts. It is the data collected as it is without any processing. The raw data is summurised and made comprehensible is known as classified data.
Question 3.
Distinguish between frequency table and frequency array.
Answer:
Frequency table is the classification of the data for a continuous variable. Frequency array is the classification of the data for a discrete variable.
Question 4.
Distinguish between univariate frequency distribution and bivariate frequency distribution.
Answer:
The frequency distribution of a single variable is called univariate distribution. The frequency distribution of two variables is known as bivariate frequency distribution.
Question 5.
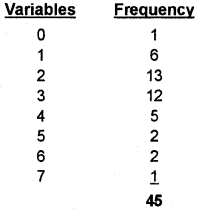
In a city 45 families were surveyed for the number of domestic appliences they used. Prepare a frequency array based on their replies as recorded below.
1, 3, 2, 2, 2, 2, 1, 2, 2, 3, 3, 3, 3, 2, 4, 2, 7, 2, 0, 3, 1, 3, 3, 2, 3, 2, 2, 6, 1, 6, 2, 1, 5, 1, 5, 3, 4, 2, 4, 3, 4, 3
Answer:
Question 6.
Classification of data is a function similar to that of sorting letters in a post office. Do you agree? Explain.
Answer:
Yes, I do agree with the statement that the classification of data is a function similar to that of sorting letters in a post office.
The process of arranging data in groups or classes according to similarities is technically called classification. The classification is somewhat similar to that of sorting letters in a post office. Letters collected in a post office are sorted into different lots on a geographical basis.
They are then put in separate bags. Thus by classification, we are trying to make different groups with similar characteristics. Units having a common characteristic place in one class and the whole data are thus divided into a number of classes.
Question 7.
List examples of variables and attributes in your daily life.
Answer:
1. Variables
- Height
- Weight
- Marks obtained in the final examination
- Cricket score
2. Attributes
- Caste religion
- Sex
- Marital status
- Educational qualification
Question 8.
There are some problems in preparing frequency distribution on the basis of class interval’. Do you agree? Justify.
Answer:
Yes, I agree.
The following problems arise in preparing frequency distribution on the basis of class interval.
- Number of class intervals to be formed
- Size of class intervals
- Class limits.
Plus One Economics Organisation of Data Three Mark Questions and Answers
Question 1.
Answer the following
- To arrange things in the appropriate order and to put them into homogenous groups means ………..
- a variable is continuous when it can be taken within the range ……….
- Population refers to ……………
Answer:
- classification
- any value
- both frequency and cumulative frequency
Question 2.
Name the three types of series.
Answer:
- Individual series
- Discrete series
- Continuous series
Plus One Economics Organisation of Data Four Mark Questions and Answers
Question 1.
Can there be any advantage in classifying things?
Answer:
The advantage of classification are the following.
- It helps in the comparison of data.
- It helps to understand relationship among variables.
- It makes statistical analysis easier.
- It highlights significant features of data at a glance.
Question 2.
State the meaning and example for the following.
- Chronological Classification.
- Spatial Classification
- Qualitative Classification
- Quantitative Classification.
Answer:
1. Chronological Classification:
In Chronological classification, data are classified either in ascending or in descending order with reference to time such as years, quarters, months, weeks, etc.
Example: population of India from 1951 to 2011
2. Spatial Classification:
In Spatial Classification the data are classified with reference to geographical locations such as countries, states, cities, districts, etc.
Example: yield of wheat in different states of India.
3. Qualitative Classification:
Attributes can be classified on the basis of either the presence or the absence of a qualitative characteristic. Such a classification of data on attributes is called a Qualitative Classification.
Example: grouping of people on the basis of gender
4. Quantitative Classification:
When the collected data of such characteristics are grouped into classes, the classification is a Quantitative Classification.
Example: marks obtained by students.
Question 3.
What is a variable? Distinguish between a discrete and a continuous variable.
Answer:
A simple definition of a variable does not tell you how it varies. Different variables vary differently and depending on the way they vary, they are broadly classified into two types:
- Continuous and
- Discrete.
A continuous variable can take any numerical value. It may take integral values (1, 2, 3, 4,…) or fractional values(1/2, 2/3, 3/4).
Unlike a continuous variable, a discrete variable can take only certain values. Its value changes only by finite “jumps”. It “jumps” from one value to another but does not take any intermediate value between them.
Question 4.
Differentiate between exclusive method and inclusive method.
Answer:
1. exclusive method, the upper-class limit is excluded but the lower class limit of a class is included in the interval.
2. On the other hand, under the inclusive method, the upper-class limit is included in the class interval.
Plus One Economics Organisation of Data Five Mark Questions and Answers
Question 1.
Differentiate between quantitative classification and qualitative classification.
Answer:
Classification done according to quantitative varieties like marks and wages etc. is termed as quantitative classification. On the other hand, classification according to attributes like honesty and beauty is known as qualitative classification.
Question 2.
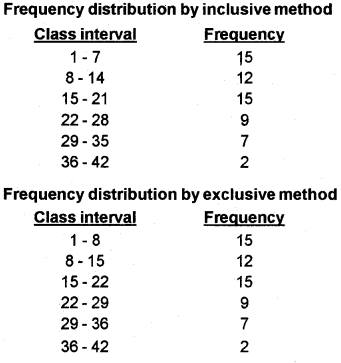
Prepare a frequency distribution by inclusive and exclusive method for the following data.
28 27 6 16 15 2 14 5 19 25 19 20 28
32 37 13 15 11 32 4 6 9 3 36 12 8
4 1 8 3 18 12 7 17 15 22 29 21 23
2 9 4 10 5 20 20 33 27 21 27 18 9
31 18 9 7 1 26 24 20
Answer:
Plus One Economics Organisation of Data Eight Mark Questions and Answers
Question 1.
Define and illustrate the inclusive and exclusive method used in the classification of data.
Answer:
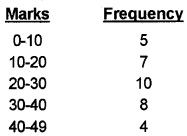
1. Inclusive Method:
In comparison to the exclusive method, the Inclusive Method does not exclude the upper-class limit in a class interval. It includes the upper class in a class. Thus both class limits are parts of the class interval.
An example of an inclusive method of a frequency distribution is given below.
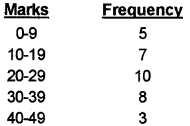
2. Exclusive Method:
The classes, by this method, are formed in such a way that the upper-class limit of one class equals the lower class limit of the next class. In this way, the continuity of the data is maintained. That is why this method of classification is most suitable in case of data of a continuous variable. Under the method, the upper-class limit is excluded but the lower class limit of a class is included in the interval.
An example for an exclusive method of a frequency distribution is given below.